Power BI Data Visualization Course
Data Visualization with PowerBI
Learn data modeling, basic & advanced visualizations, creating advanced charts, and working with parameters. Join this Power BI Data Visualization course to build dynamic dashboards that turn data into powerful visual insights.
About this course
This Data Visualization Essentials with Power BI course will help you develop the skills needed to create powerful visualizations and perform detailed data analysis. You will start by learning the basics of Power BI, including dashboard creation and data visualization. As you advance, you will master techniques like hierarchical charts, clustering, and What-If analysis, enabling you to uncover deeper insights. You will also enhance your reports with features such as conditional formatting and tooltips, making your dashboards more interactive and impactful.
By working on hands-on projects, you’ll apply your skills to real-world data, gaining practical experience in analyzing complex datasets, designing efficient dashboards, and generating valuable insights. By the end of this course, you’ll be able to use Power BI to streamline data analysis, create professional reports, and support data-driven decision-making. Whether you’re looking to analyze business performance or present data in a clear, interactive way, this course will equip you with the tools you need to succeed in a data-driven environment.
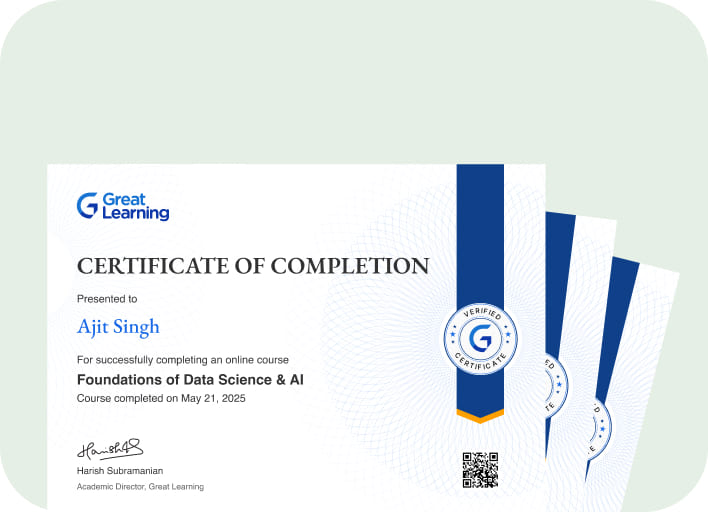
Earn a certificate with an Academy Pro+ subscription
Stand out to recruiters
Share on professional channels
Globally recognised
Land your dream job
Course outline
Industry focussed curriculum designed by experts
Introduction to Power BI & Basics
5 videos
1 Hour
- Overview of Power BI
- Overview of Power BI Desktop
- Analyse and Ask a Question
- Basic Dashboarding
- Importing Data in Power BI
Data Modelling & Basic Visualizations
7 videos
1 Hour
- Flow Map
- Introduction to Data Modelling
- Funnel Chart
- Gauge Chart
- Bubble Chart
- Histogram
- Heat Map
Advanced Visualizations
4 videos
1 Hour 10 minutes
- Hierarchy
- Clustering
- Creating Calculations
- Cross Filter
Dashboard Design & Storytelling
5 Videos
2 Hour and 10 minutes
- Relationship between variables
- Dashboard Design and Storytelling
- Pareto Chart
- What-if Analysis
- Storytelling
Advanced Techniques & Analysis
4 videos
1 Hour
- Waterfall Chart
- Steps to Data Visualization
- Setting levels of Interactivity
- Summarization techniques
Conditional Formatting & Tool Tips
3 videos
1 Hour
- Tool Tips
- Table creation and conditional formatting
- Use of logical calculation
Guided Project : FIFA 2018 Player Analysis
Get access to the complete curriculum with your free trial
Start 7-Day Free TrialGuided Projects
Solve real-world Power BI Data Visualization projects with a step-by-step guide, starter code templates, and access to model solutions to boost your skills and build a standout resume.
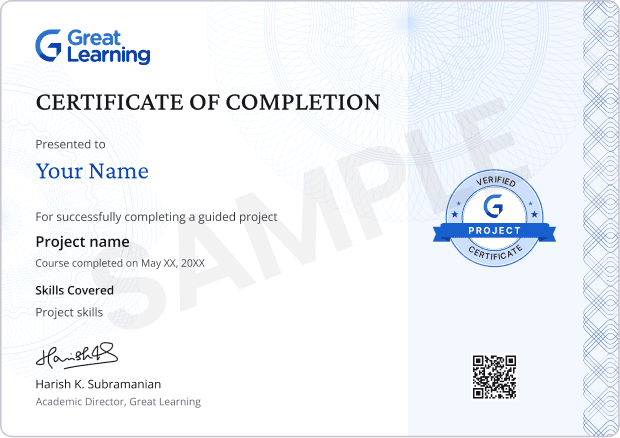
Get a project certificate to add to your resume
Earn a certificate for every project you complete.
- GUIDED PROJECT 1
- FIFA 2018 Player Analysis
- This project explores FIFA 2018 player data, including personal info, wages, physical stats, skills, potential, and positional strengths. Through data analysis, we uncover insights into player performance and the strategic decisions football managers make behind the scenes.
Gain skills & build your resume with complete access to guided projects in your free trial
Start 7-Day Free TrialCourse Instructors
Mr. R Vivekanand
Co-Founder and Director
Our Learners Experience
Frequently Asked Questions
What topics are covered in this Data Visualization using Power BI course?
This course covers Power BI fundamentals, including key features, data modeling, and basic visualizations. It also explores advanced visualizations, dashboard design, storytelling, advanced techniques like What-If analysis, and using conditional formatting and tooltips.
What will I learn in this Data Visualization with Power BI course?
You learn how to import data, model it, and build dashboards. You use basic and advanced charts, conditional formatting, tooltips, and interactive elements. You also learn what-if analysis and data storytelling through a guided project.
What are the key highlights of these Pro courses?
The key highlights of our Pro courses are:
Self-paced learning for your convenience
Comprehensive short courses with industry-relevant curriculum
Learn foundation to intermediate-level skills
Hands-on guided projects and interactive coding exercises
Get recognised with a certificate of completion
AI support for interactive learning & mock interviews
What is the course duration, and what support do I get?
You get about 7.5 hours of video lessons and one guided project. You also get practice exercises, a mock interview, and 24x7 AI assistance.
Will I receive a certificate after completing this course?
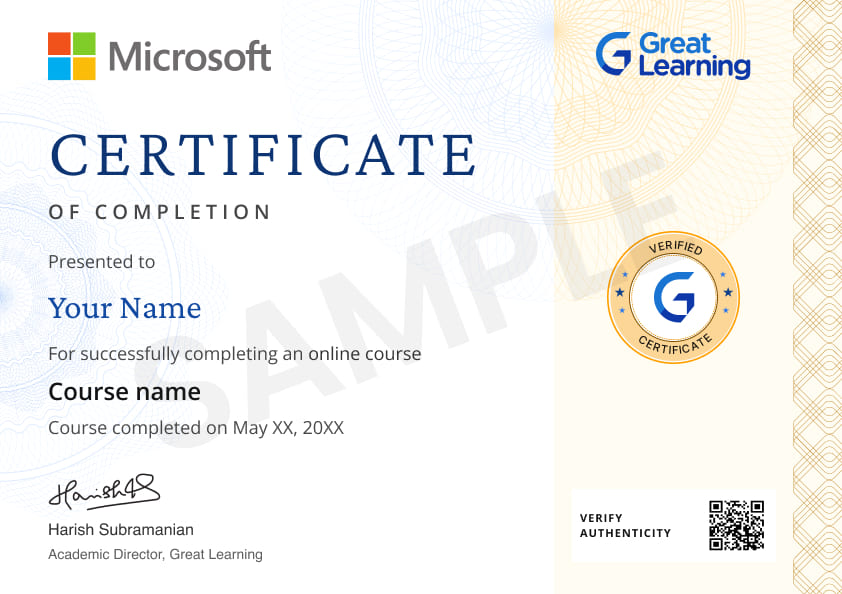
Yes, you will earn a certificate once the course is completed successfully. This certificate can be shared on LinkedIn and added to your resume, which will help you demonstrate your skills in analyzing and visualizing data with Microsoft Power BI.
Is this Power BI course suitable for beginners?
Yes, the course starts with simple concepts such as Power BI Desktop, data import, and basic dashboard creation. It moves step by step, so beginners stay comfortable.
What skills will I learn in this course?
You build skills in data modeling, chart creation, dashboard design, conditional formatting, logical calculations, and clear data storytelling.
What is the difference between this Pro and the free Power BI Data Visualization course on Great Learning Academy?
This Pro course gives more structured, in-depth personalized learning with hands-on guided projects, AI tools, mock interviews, and a certificate recognized by the industry. It provides hands-on applications and advanced ideas that extend beyond the fundamentals learnt in free courses, ensuring you learn to become a true professional and confidently approach interviewing for jobs.
What guided project is included in the course?
You complete the FIFA 2018 Player Analysis project, where you study player data and build visual insights using Power BI.
Do I get a certificate after completing the course?
Yes, you receive a Microsoft-recognized certificate upon completing the course with an active Academy Pro+ plan.
Does this course include a mock interview?
Yes, the course includes a mock interview that helps you prepare for standard Power BI and visualization questions.
Are there any prerequisites to learn Power BI?
You need basic computer skills. The course covers all core Power BI concepts from scratch.
How will this Power BI course help my career?
You learn practical visualization skills used in roles like data analyst, BI analyst, MIS executive, and reporting analyst.
Is the Power BI course self-paced?
Yes, the course is self-paced, so you can learn anytime after activating your Academy Pro+ access.
Subscribe to Academy Pro+
Build skills and prepare for jobs with access to 500+ courses, certificates and tools.
Subscribe To Pro+ • $25/MonthSkill Prep
Build skills with courses, practice with tools and earn certificates.
500+ courses
500+ Coding Exercises
Microsoft & AWS certificates

Job Prep
Work on industry-relevant scenarios, build professional resumes & prepare for jobs with mock interviews
50+ Guided Projects
AI Resume Builder
AI mock interviews





.jpg)




 (1).png)


 (1).jpg)

.png)

.png)
.png)
.png)
.png)
.png)
.png)
.png)


.png)


.png)
.png)
.png)




.png)



.png)
.png)
.png)


.jpg)
.png)
.png)

.png)
.jpg)

.jpg)
.jpg)
.jpeg)
.jpg)
.jpg)
.png)
